
We stage the data of a territory, a collection or a story as maps to explore. An invitation to discovery — self-guided or led — through narrative.
01 — Challenges
What we offer
Make a mass of data readable
Thousands of places, objects or actions to show without overwhelming the audience: the map must prioritise, filter and spark the desire to go further.
Make a territory understandable
A field programme, a heritage site, a city: geography becomes the narrative thread, so everyone grasps the scale and the links between places.
Reach every audience
Specialists and the curious, on desktop, mobile or a touch kiosk: the same map must stay accessible in form and rigorous in substance.
02 — Deliverables
What we design
Interactive web map
A site or embeddable module, free or guided navigation, filters and search, optimised for mobile as well as desktop. Designed with the user first.
Geolocated mobile app
On-site journeys, step-by-step guidance and offline content, on iOS and Android. A format shaped to the need.
Map for kiosk or museum
A touch interface designed for the exhibition space, with modes adapted to use: discovery, or precise search depending on the context.
Data visualisation and guided storytelling
A “story” mode that narrates, an exploration mode that proves: figures, points of interest and media tied to the map. Whether the map takes centre stage or steps back is defined by your goals.
03 — Method
How we work
Scoping and data
Goals, audiences and sources: we audit existing data (GIS, OpenStreetMap, business databases) and define together what the map should show.
Narrative and UX
Adapted journeys, levels of reading and key screens: we think of the map as a storyboard before we draw it.
Art direction
Cartographic style, iconography, typography and sound world, so the map carries the project’s identity in every form.
Development and launch
Optimised tiles, real-time 3D, multilingual back office, testing on every device, KPI tracking after launch. The map is rich in information for you as well.
04 — References
Projects
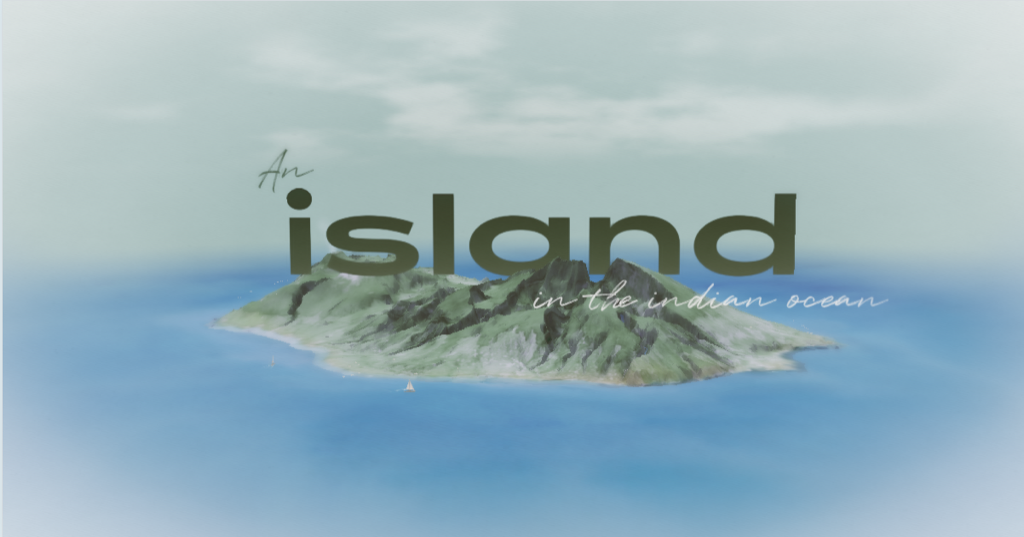
Feel the experience of a crossing of Réunion
- Cartographies
- Culture & heritage
View the project
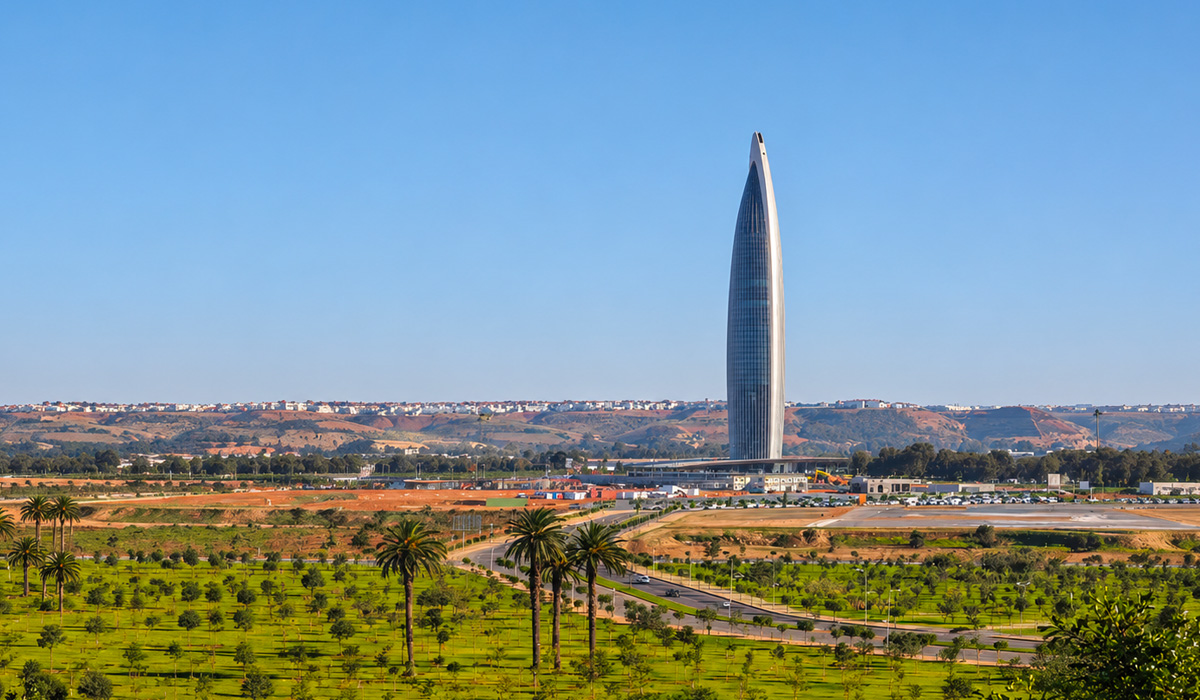
Enter the landscape.
- Cartographies
- Culture & heritage
- Installations
View the project
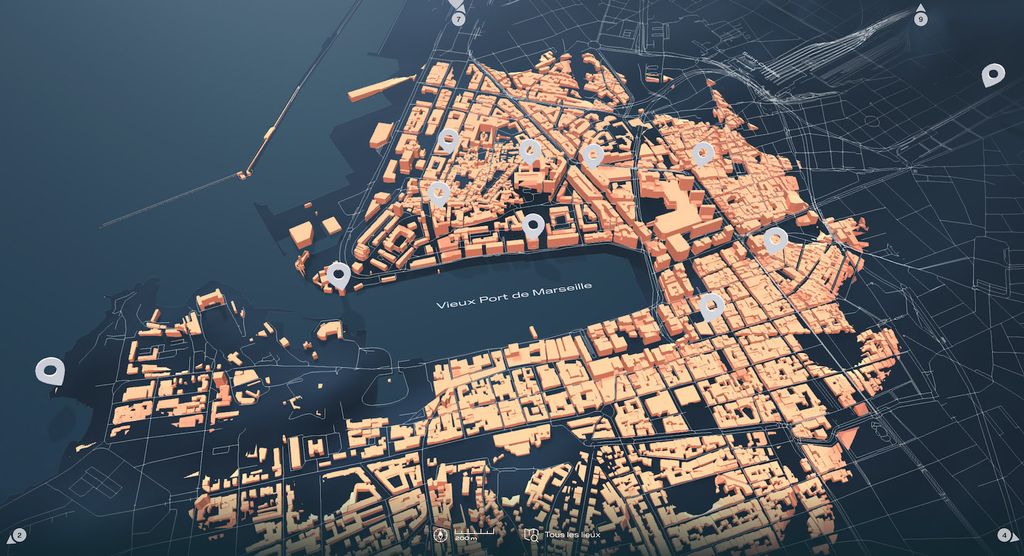
Restore Marseille to its former glory
- Cartographies
- Culture & heritage
View the project
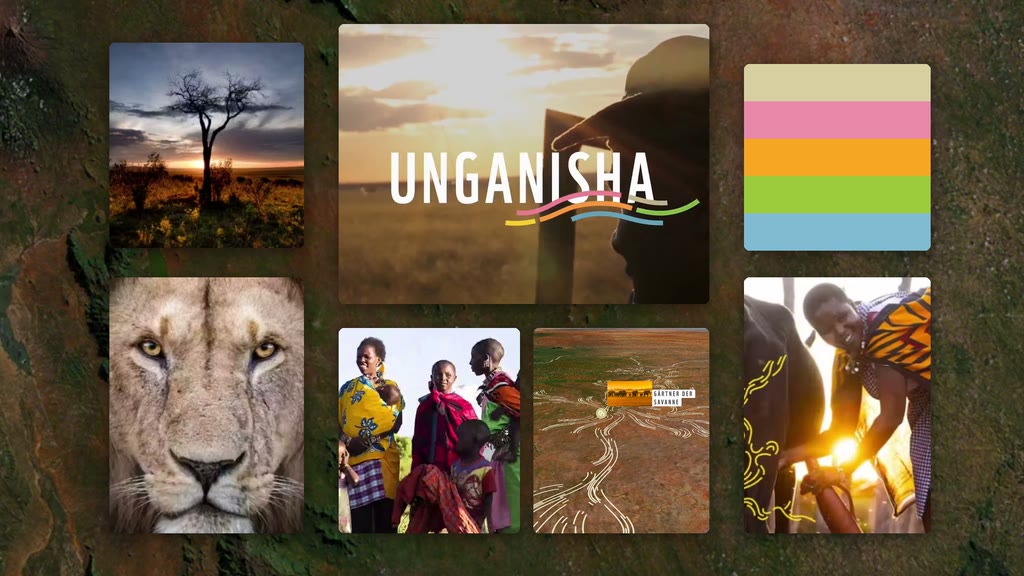
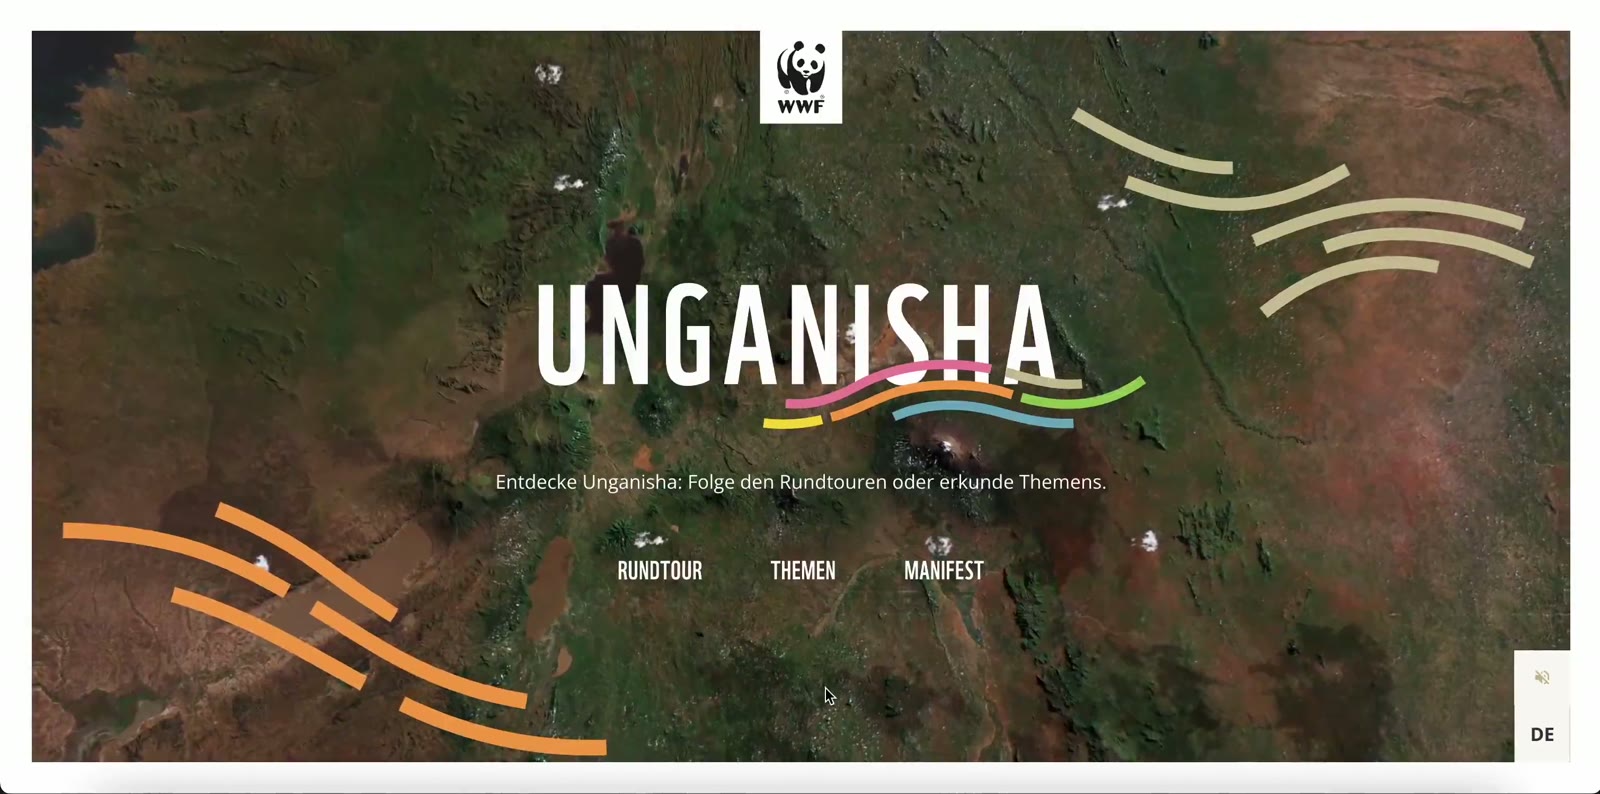
Raise awareness of WWF’s concrete actions
- Cartographies
- Institutions & NGOs
View the project

Ques — tions
What data do you work with?
With yours (collection databases, field data, GIS files) and open sources such as OpenStreetMap. For the Mucem, we extracted and restructured more than 6,000 references from the museum’s collection-management software.
Does an interactive map work on mobile?
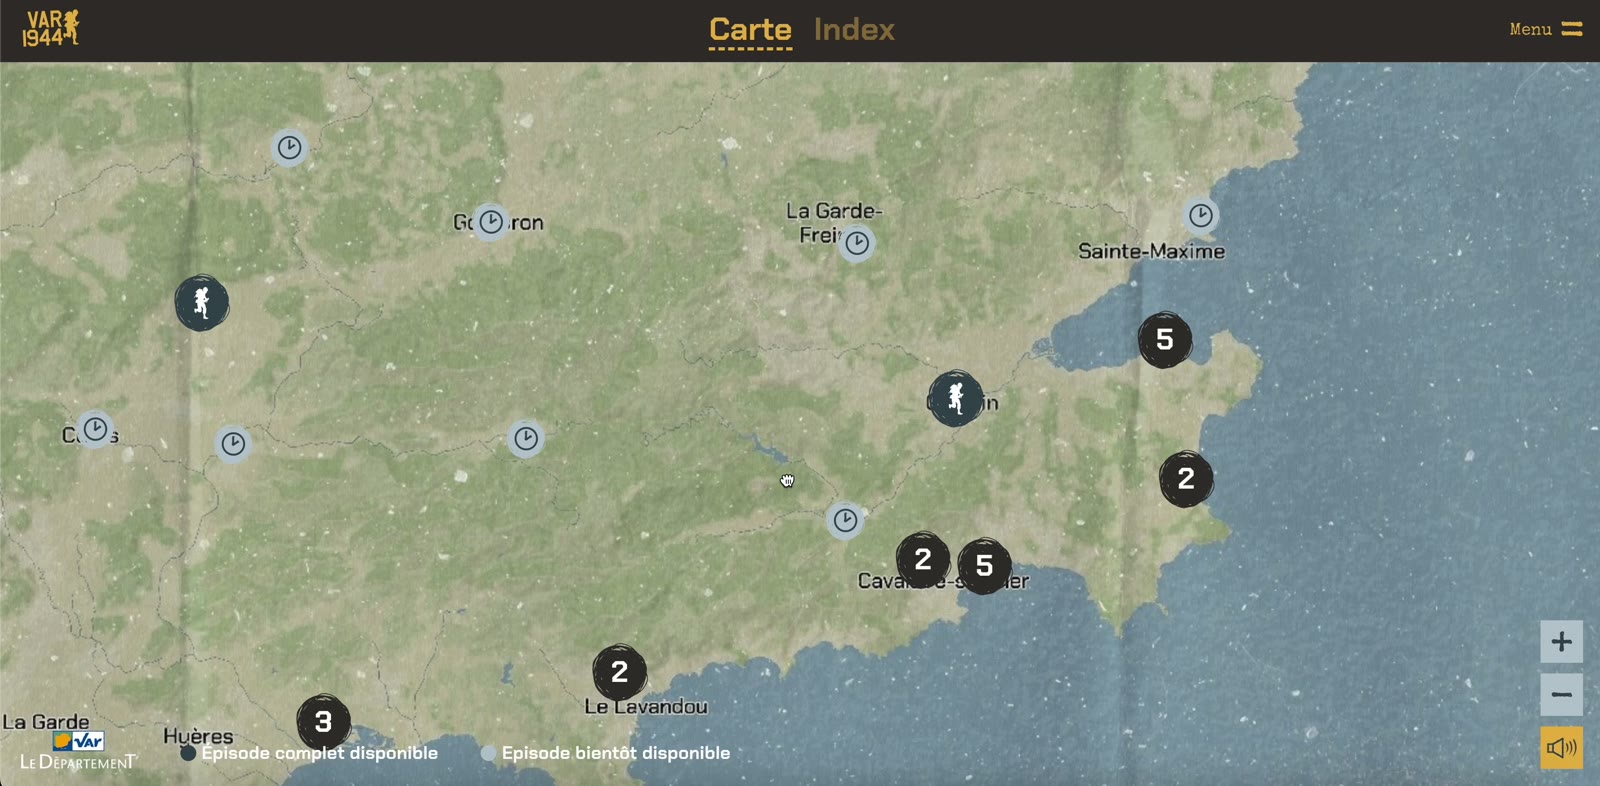
Yes — it is a requirement from the start. Our maps are optimised for mobile, and can become a geolocated app with offline browsing, as with Var 1944.
Can we update the content ourselves?
Yes. We deliver a back office to add places, texts and media, including in several languages.
How long does it take to design a map?
Typically two to six months, depending on data volume, level of interactivity and target formats (web, app, kiosk).